Recently on Cyclingnews.com |
|
|
View from the lab - Ric Stern's Tour de France sports science
British ABCC coach Ric Stern (www.cyclecoach.com) is a regular contributor to Cyclingnews' Form & Fitness section along with being a full time coach. Still an active rider when time allows, Ric will be providing a physiological insight into the challenges that face the riders in the Tour.
July 7: Stage 10 - Number crunching
|
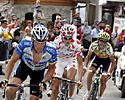
After yesterday's rest day, the Tour resumes with a monstrous stage that finishes at Courchevel Altiport at 2000 metres high. The riders will have also had to tackle the Cormet de Roselend at 1967 m high. It's clear that only a few select members of the peloton will be looking forward to today (and even those that are aiming to do well, may not actually be that 'excited' about it!) - the climbers and the riders aiming for a high position on the general classification. Additionally, a group of riders who are lowly placed may be allowed to escape.
Currently, the situation is a small group of seven riders are away on the Cormet de Roselend, and a select group of the main players and their domestiques are currently riding tempo behind the leaders. During these long climbs - much like a time trial - the maximum effort that can be sustained is around zone 4 to zone 5. However, during the first climb the main group with the best riders in, they'll be generally riding at a heavy tempo - probably around zone 3 to 4. Not flat out, but enough to dispatch all but the best.
The velocity that the riders' travel at is governed by simple physics, they are laws that all cyclists know only too well! Tugging away the riders' jerseys and trying to slow us down is gravity, with its relentless and unforgiving force acting upon us. To overcome this main force that is slowing us down, we generate power and move forward. The more power that we produce the faster we go (under given conditions). However, when we compare ourselves to the others in the peloton, it is not just how much power we are producing, but our total mass as well that slows us down.
|
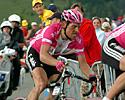
We all know that the heavier a person is, the more effort (power) they have to generate to move forward when going uphill. In other words the power we produce, divided by our body mass will, for the most part, determine how fast we travel when going uphill.
The big guns of the TdF will be able to put out around 6.5 W/kg for a long mountain climb that takes up to 1 hour to complete. If you have a mass of 70 kg (that's a weight of 154 lb for you non-metric people!) it's a staggering 455 W. To give you an idea of what that means your average second or third category male rider may be able to hold that power to mass ratio for around 60 - 120 seconds or so. I can confirm that that type of effort makes me worry that I may lose my (dental) fillings!
Ok! The stage has just finished and I'm desperately trying to collate some data to make sense of the stage and the last climb. I don't have the exact data, so I have to estimate some times for the climbs and masses for the riders. So science geeks, lets crunch some figures!
According to some online reports both Lance Armstrong and his chief rival Jan Ullrich are 73 kg (~161 lb). The final climb to Courchevel is 22.2 km long and it appears that the time taken for Lance and Alejandro Valverde to climb it was approximately 53 minutes. That's an average velocity of 25.1 km/h. According to the Tour de France website Courchevel is an average gradient of 6.2 %. If we assume (yes, I know this is all lots of assumptions, but I'm finding it fun, so stay with me!) that Lance's Trek and Jan's Giant are both the same weight (8 kg) plus several kg for clothing, helmets, and food and drink we can run these data through www.analyticcycling.com. Here's what we get.
Lance climbs at an average velocity of 25.1 km/h and requires an average power output of 453 W.
Jan climbs (2 plus minutes slower) at an average velocity of 24.2 km/h and requires an average power output of 431 W.
|
In other words assuming that my assumptions about times taken and masses are correct Lance is 5% fitter (i.e., more power) than Jan. Now, clearly, I've made some guesstimates today about times and masses of riders and bikes, but interestingly 453 W divided by 73 kg is 6.2 W/kg, which is what is believed to be close to the (approximate) current limit of human performance over a duration of ~1-hour (6.5 W/kg). Interestingly, we know that Chris Boardman was able to generate ~ 6.5 W/kg when he smashed the World Hour Record in the ‘Superman' position.
Clearly, I've been excited by the data today, so very briefly, and making a stack load more assumptions I estimated via www.analyticcycling.com the power required to ride the stage 1 opening time trial. I've assumed that both Lance and Jan are as aerodynamic as each other for this very quick and approximate estimation. Power required for stage 1 for Lance was 480 W and 465 W for Jan, which is just over a 3 % difference between the two.
Perhaps, this could mean that once Jan was distanced today and knew he couldn't stay with Lance he eased up a little. It could also mean he was more fatigued on the stage (e.g., he'd not eaten enough) or one of many other reasons.
These calculations could be performed for other riders' data - it would be interesting to see what, say Michael Rasmussen or Alejandro Valverde produced today, but as yet I can't find their body mass data anywhere...
Please remember that I have only approximated times, masses, and power outputs, and done everything fairly quickly. There's bound to be some errors somewhere, but I'll say the values are definitely in the ballpark. Now, lets see what happens tomorrow and how the riders recover. It should be another very interesting day.
2005 entries - the Tour de France
- July 28 - Stage 21 - What it takes
- July 23 - Stage 20 - Getting the TT right - and wrong
- July 22 - Stage 19 - The perfect break
- July 21 - Stage 18 - High intensity and fatigue
- July 19 - Stage 16 - Maintaining an attack
- July 17 - Stage 15 - Tour's biggest day
- July 16 - Stage 14 - Attacks keep coming
- July 15 - Stage 13 - Positive thoughts
- July 14 - Stage 12 - Hot, hot, hot!
- July 13 - Stage 11 - Big efforts uphill
- July 12 - Stage 10 - Number crunching
- July 7 - Stage 6: The dynamics of a breakaway
- July 6 - Stage 5: Coming back after a TT
- July 5 - The TTT - Man, machine and team
Previous Cyclingnews features by Ric Stern
- Winter Training
- Weight training and cycling - The Great Debate
- Power zone training - How to set training levels with a power meter
- Ric Stern also answers Cyclingnews readers' questions in our Form & Fitness Q&A section
