Recently on Cyclingnews.com |
Power zone training
By Ric Stern*
Power meters – such as the Graber Power-Tap and SRM Power Meter – enable you to measure your actual power output, rather than relying on approximations such as heart rate. With knowledge of your maximum power output, you can set power-based training zones . First, though, you're going to have to undergo a little test, as Richard Stern explains.
With the advent of outdoor power meters such as Graber's Power Tap unit, athletes are now able to accurately ascertain actual racing/training power outputs. As power output defines our performance, either as power to mass ratio uphill, or power to aero drag in time trials, it is possible to predict actual performance levels, or specific goal improvements needed to meet race/performance criteria.
As more and more athletes begin to train with power output, rather than heart rate, or rate of perceived exertion (RPE), guidelines need to be set for training by people experienced in power output training, such as sports scientists, coaches, and so on.
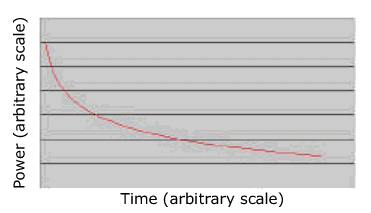
Over the past sixyears I've developed and refined an eight level training system, and a seven level race prediction system, based on a short, demanding, test to exhaustion of generally less than 15 minutes duration. The two systems are based on the Power/Time Curve (below) that exists for all athletes.
 |
Prior to the Test
The test is similar to a ramped test to exhaustion/VO2 max test/stress test, and although relatively short in duration, does require you to push yourself to exhaustion - it is, therefore, very demanding.
Accordingly, you should be certain of the following:
- You are not currently suffering from any viral or bacterial infection, or any other illness
- You have not had a viral or bacterial infection, or any other illness, within the last four weeks
- You do not have any injuries or recent injuries
Do not undertake the test:
- If you are over 35 years of age, or are overweight, without first seeking approval off a qualified medical practitioner
- If you are a smoker (or have given up within the last year)
- If you have been diagnosed with any form of heart disease, or suspect heart or vascular disease
- If you are hypertensive
- If you suffer from an airway obstructive disease, such as bronchitis
If you are in any doubt about your suitability of conducting this, or any physical exertion test then you should consult with a qualified medical practitioner, such as your family doctor, or a doctor who is treating you for any conditions that you may have.
The test pushes your body to the limit - do not put yourself at risk.
Because of the intensity involved, I would caution against eating within two hours of the test, with most people consuming a high carbohydrate meal about hours before the test. In the final twohours prior to testing you should continue to sip on an energy drink.
The Test
The test needs to be conducted on an indoor trainer (not rollers), and requires you to be well rested, such that you should have a light training week prior to the test. Two days prior to the test, I normally have my riders have a complete day off, and the day before is an easy ride of 45-90 minutes duration.
The ramp rate – the rate at which the intensity increases – is based on gender and broad fitness levels. Starting power output should begin at an easy level, and the test needs to last about 8-15 minutes. Accordingly, for most competitive cyclists over 18 years of either gender, starting power will usually be 100W or greater.
- Female riders should use a 15W/min ramp rate
- Elite male riders should use a 20W/min ramp rate
- Non-elite male riders should use a 25W/min ramp rate
Rather than have the power ramp up steeply every minute, I split the ramp into small units. For instance, with a 25 W/min ramp rate, I have riders increase power output 5W every 12 seconds.
Set your bike on the trainer, and decide on your starting power. Prior to the test proper, warm up for 10-20 minutes and include a few brief race efforts at the halfway point to get you going. Start the test, and set the interval function on your Power Tap to record the actual test. Have a friend stay with you throughout the test so that they can urge you on.
Once underway, there are no rest periods as in some tests; you should keep upping the power until you can no longer match the predetermined power output. At this point you should really 'dig in' giving a final effort to try to match the correct power. During the test, you can change gear, and vary your cadence to suit the effort required. I would, however, advise against standing up, as this may cause the trainer to topple over.
As soon as the test is finished, switch to your small chain ring, and ride at recovery level for 5-10 minutes. Stop the interval function on your CPU (or get your friend to do this).
As soon as the test is over you should sip on a high glycaemic energy drink, to help restore muscle and liver glycogen stores. You should try and eat 1.0-1.5 grams of carbohydrate per kilogram of body mass within 20-60 minutes of the test.
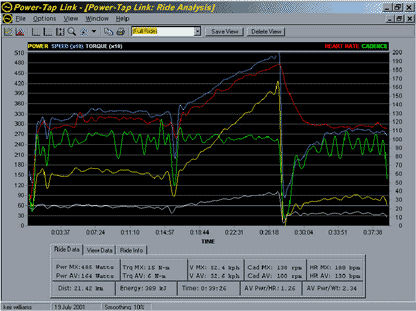
Once you've recovered, download the Power Tap CPU to the Link software, where you can then analyse it. You'll get a graph something like this:
 |
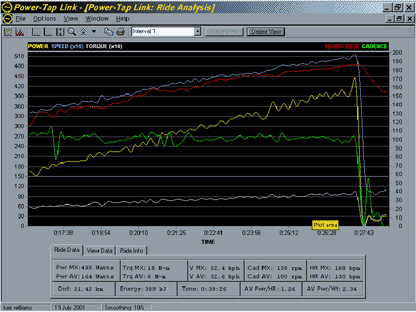
At this point you should select the test data (interval 1), which will allow you to see the data in detail:
 |
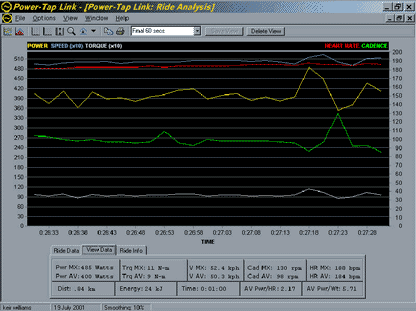
Finally, select the final 60 seconds of the test, which will be the highest power outputs recorded:
 |
The Zones
Once the final 60 seconds has been displayed, and averaged to give what's termed your Maximal Aerobic Power Output (MAP), you can set about defining your training zones based on MAP. There are eight zones that I specifically identify; six are non-discrete. Heart rate zones based on Peter Keen's four levels are also shown for approximate comparison.
Zones
Zone   Power Output                    Heart Rate   Intensity
         (% of MAP)              (based on HRmax)

Recovery   Up to 40     40 - 60 b/min below HRmax     Recovery
1           40 - 55     45 - 50 b/min below HRmax    Endurance
2           50 - 65     40 - 45 b/min below HRmax    Endurance
3           60 - 70     30 - 40 b/min below HRmax    Endurance
4           65 - 75     25 - 30 b/min below HRmax    Intensive
5           70 - 85     15 - 25 b/min below HRmax    Intensive
6          80 - 110      0 - 15 b/min below HRmax      Maximal
7         110 - 150      0 - 15 b/min below HRmax      Maximal
Why are some of the zones non-discrete?
Generally, when riding outdoors power fluctuates, due to a variety of conditions such as gradient, cornering, traffic, and intensity. Because power can drop rapidly, average power can be distorted, and can sometimes not seem representative of what you were doing during training. For that reason the zones were overlapped. Furthermore, by examining your training sessions in the power zone histogram function in the Link software you can see where you were putting the majority of your effort, and how mean average can differ from modal average power. The non-discrete zones also reflect that physiologically, 'zones' are non-discrete and are in continuum.
How do the Zones help you?
As with any previous training system, such as heart rate, each zone is specifically aimed at various physiological criteria.
Recovery Zone: This zone is designed to be a very light workload, such that it causes no significant adaptations, and also limits the cyclist to an easy session, thus preventing a build up of fatigue, or to help in the return after being ill/injured.
Zones 1-3: These zones are primarily designed to help with endurance, allowing high volume, low intensity work to be completed. Zone 2 forms the 'core' of an endurance cyclist's training programme. At the lower zone, fat is the predominant fuel source, with carbohydrate usage increasing as intensity increases.
Zone 4-5: These zones are increasing in intensity, and somewhat-to-very fatiguing. Time trials, and solo/small group 'breaks' in road races are at this level. Lactate levels are just below to above 'threshold', and carbohydrates are the main energy supply.
Zone 6-7: These zones are maximal, and accordingly, rely solely on carbohydrate as the fuel supply. Before attempting training in these zones, the rider must be fully recovered and mentally 'up' for it. At this intensity, the rider is bridging a small gap, or climbing a moderate hill (for example, one that takes up to five minutes) at maximal effort. Physiologically, you're at VO2 max or above.
Benefits and characteristics of each training zone:
Power Zone
|
Workout classification / Event Type |
Physiological adaptations / training benefits |
Zone 0 |
|
|
Zone 1
|
|
|
Zone 2
|
|
|
Zone 3
|
|
|
Zone 4
|
|
|
Zone 5
|
|
|
Zone 6 |
|
|
Zone 7 |
|
|
Can race performance power be estimated?
Although race performance can be down to mental strength as much as physical ability, a power/time curve exists such that the longer the event, the lower the power output. For endurance-based events, an estimate of the power output that can be achieved for a variety of distances is shown below.
Distance/Event    Power range
                   (% of MAP)

3 km TT             89 - 91
4 km TT             88 - 91
16.1 km TT          75 - 81
40.2 km TT          72 - 77
80.5 km TT          64 - 72
161 km TT           60 - 68
Because events such as road races, and criteriums depend on both drafting ability as well as power to mass ratio, it is a little harder to predict power for these events, but, based on experience, these ranges cover most races. However, they are not now based on percentage of MAP, but on body scaling. Road races longer than 90 minutes duration are generally between 11 and 14 Wkg0.67, whilst short criteriums are generally 14-18 Wkg0.67. Accordingly, for a 70kg rider, average power would be 190-241W for a road race, and 241-310W for a criterium.
 |
Richard Stern is a cycle trainer, Sports Scientist, and writer, who has been professionally helping cyclists and triathletes for over 3 years. He has helped riders to national and international success in time trials, road racing, track racing, cross-country and downhill mountain biking. His research has been published in the Canadian Journal of Physiology, and has had articles in Cycling Weekly, The Independent, and other media.
Tel + 44 (0)1443 222718
Email: ric@cyclecoach.com
Web site: www.cyclecoach.com
