
Recently on Cyclingnews.com |
Tech feature, November 28, 2008
How aero is aero?
|
You want to get faster against the clock. You want to know if you spend X you will get Y time savings in return. Problem is, you're bamboozled by a plethora of marketing hype and scientific data put out by companies who want you to buy their stuff, whether it be snazzy equipment or even time in a wind tunnel. Where do you start? Jeff Jones shines a light on the topic.
Let's break it down into a simple question:
How much time can you save by going from your normal road bike and helmet to adding clip-on handlebar extensions to a full-on time trial bike with an aero helmet? That's it. All other equipment (wheels, tyres, clothing) stays the same.
The answer is quantifiable but finding it is another matter. You need to know what you're doing, and most of us don't. Luckily there are people called engineers in the cycling world whose job it is to find the answers to these questions.
|
Key points Position: Going from drops to aerobars will save you ~30 watts at 40km/h Bike: A time trial bike will save you ~20 watts over a road bike with clip-ons at 40km/h Helmet: A time trial helmet will save you ~10 watts over a road helmet at 40km/h |
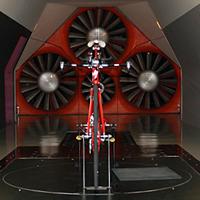
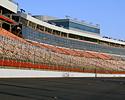
We were given the opportunity to spend a day with Specialized's young aerodynamicist Mark Cote at the A2 Wind Tunnel and Lowe's Motor Speedway in North Carolina. It's NASCAR heartland here, and they put a lot of money into aerodynamic testing facilities. The A2 Wind Tunnel, the smaller brother to the AeroDYN tunnel, is used to test small vehicles and bicycles. It's one of the cheapest in the US at $390 per hour (compared to $800/hr for the San Diego tunnel) and the tunnel managers Mike Giraud and Dave Salazar know exactly what they're doing when it comes to bikes. Plus they can compare wind tunnel data to on road data by using the nearby Lowe's Motor Speedway, a 2.3km banked NASCAR oval.
|
For the test, Mark enlisted the help of Nathan O'Neill, eight time Australian time trial champion who has raced for European and US pro teams for the past eight years. He's coming off a 15 month ban (expired November 12, 2008) after testing positive for the appetite suppressant Phentermine, which bizarrely is legal out of competition but illegal in competition. But his experience as a wind tunnel subject, time trialist and of course his availability makes him an ideal test rider.
How it's done
Wind tunnel measurement is currently considered the gold standard of bicycle aerodynamic testing. For best results, you need the rider on the bike to be able to hold their position stable while pedalling. You can test the bike alone, but it makes more sense to have someone on it, because the overall shape will be completely different. You also need to test over a range of yaw angles (wind direction relative to the rider's direction) to account for crosswinds, because aerodynamics are significantly affected by wind direction.
The downside of doing this in a tunnel is that you can't account for handling in a crosswind, because the bike is fixed to a set of rollers.
Testing outdoors is useful because it's closer to real world conditions. That said, it's time consuming and you still need to control as many variables as possible. Even if you have a smooth flat track and precise measuring equipment, like the SRM cranks and mobile weather station that we had, too much wind will give you large errors, even greater than what you are trying to measure.
The 70 watt benchmark
|
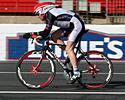
In late July, Cote and his team did a series of tests comparing a standard road bike (Specialized Tarmac SL2 with HED Bastogne wheels) to a full time trial bike (Specialized Transition with HED3 Trispoke wheels and a Specialized TT3 aero helmet).
They compared wind tunnel data with track testing at the Lowe's Speedway and the Asheville velodrome, which consisted of several 10 mile and 1km time trials at a constant speed of 40km/h. They were lucky to have near ideal conditions for the outdoor tests, which kept the measurement errors down to around 2% of total power. The corresponding errors in the wind tunnel are under 1%. From doing this, they found the outdoor testing validated the wind tunnel testing, but did not replicate it.
They also found that outdoors there was a 60-70 watt saving at 40km/h between the normal road bike setup, which required ~280-290W at this speed, and the full time trial setup (~220W). That worked out at between 22-24% in aerodynamic savings. To put it another way, it was 9 seconds per kilometre, 2'14 per 10 miles (16.1km), 5'33 per 40km, and 24'58 over 180.2km, the distance of the bike leg in an Ironman triathlon. Or another way, if you can ride a road bike at 40km/h and switch to a time trial bike and helmet, you can do over 44km/h.
In the controlled environment of the wind tunnel, the savings were greater: between 32-42%, depending on yaw angle. These are aero savings only. About 70% of total power goes towards aero. So 70% of 32-42% = 22-29% of total power. This almost exactly matches the 22-24% from the track The bigger the crosswind, the better off you are on a time trial bike because of the sail affect. Of course, you've got to be able to keep the thing upright...
Drilling down
|
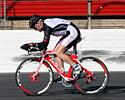
So how do we break down that 70 watt saving? How much is position, how much is the bike, how much is the helmet and how much is the wheels? That was the purpose of this test, although we didn't actually test different wheel configurations, so we were looking at ~60 watts worth of savings.
Mark Cote decided on five protocols:
Tarmac SL2 road bike | SWorks Road Helmet | Drop bars
Tarmac SL2 road bike | SWorks Road Helmet | Clip-on aerobars
Tarmac SL2 road bike| TT2 Helmet | Clip-on aerobars
Transition time trial bike | SWorks Road Helmet | Aerobars
Transition time trial bike | TT2 Helmet | Aerobars
For each one, we used the same wheels (Roval) and tyres, and Nathan rode in a short sleeved skinsuit with arm warmers and full finger gloves, but no shoe covers. The mass of the bike + rider was 83kg.
All five setups were tested over two laps (4.6km) of the Lowe's Motor Speedway at as close to 40km/h as we could get. The tests were repeated in the wind tunnel later that day. During each test, Mike Giraud acted as a control, riding his bike around the circuit at ~32km/h, with a wind probe attached to the front of his bike that could measure wind speed and direction. The probe looked like it could double as a harpoon, but luckily there were no whales on the circuit.
It was a clear, sunny November morning but the conditions weren't quite ideal at the Speedway. While we could account for the changes in temperature and humidity, the wind affected things at little.
[CdA = Coefficient of drag x frontal area]
|
Speedway data
|
Set-up |
Estimated Ave CdA (m^2) |
Speed (km/h) |
Power (W) |
|
Tarmac SL2 | Road Helmet | Drop bars |
0.310 |
40.10 |
306.6 |
|
Tarmac SL2 | Road Helmet | Clip-on aerobars |
0.267 |
40.27 |
268.6 |
|
Tarmac SL2 | TT2 Helmet | Clip-on aerobars |
0.256 |
40.38 |
261.0 |
|
Transition | Road Helmet | Aerobars |
0.265 |
40.17 |
262.9 |
|
Transition | TT2 Helmet | Aerobars |
0.230 |
40.05 |
229.0 |
On the plus side, the trends were accurate and there was still that big 77W (25%) difference between the road bike and the full TT setup. And it looked as though position would account for about half of that. But as for deciding how much the bike was worth relative to the aero helmet, it was tough. This appeared to be because of an unreliable data point, as the time trial bike plus road helmet should have required about 240W rather than 263W at 40km/h. We suspected this was because of an SRM calibration error, rather than the wind on the track, but at the time of publication this was an known unknown.
Wind tunnel testing
|
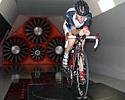
Mark was happier once we got into the wind tunnel. Nice repeatable data that did make sense and gelled with his considerable testing experience. The testing was done at yaw angles of 0 and 10 degrees in 48.3km/h (30mph) wind, which was extrapolated back to 40km/h.
Wind tunnel data
|
Set-up |
Wind Tunnel 0 CdA (m^2) |
Speed (km/h) at 278W |
Power req'd at 40km/h (W) |
|
Tarmac SL2 | Road Helmet | Drop bars |
0.3019 |
40.00 |
278.3 |
|
Tarmac SL2 | Road Helmet | Clip-on aerobars |
0.2662 |
41.65 |
248.9 |
|
Tarmac SL2 | TT2 Helmet | Clip-on aerobars |
0.2547 |
42.25 |
239.5 |
|
Transition | Road Helmet | Aerobars |
0.2427 |
42.90 |
229.6 |
|
Transition | TT2 Helmet | Aerobars |
0.2323 |
43.50 |
221.0 |
|
The nice thing about this set of protocols is that there are two separate ways of comparing bikes and helmets. The difference between the Specialized road helmet and the TT2 was 8.6W or 9.4W, depending on which set of protocols we chose. The difference between the Specialized Tarmac SL2 with clip-ons and the Transition was 18.5W or 19.3W. Finally, the difference between a road frame and one with a set of clip-ons on it was a whopping 29.4 watts. This difference is due to rider position (in the drops vs. in the aerobars).
That's 60 watts accounted for in savings. The July tests showed 70 watts, but the wheels were also changed in that one so we can guesstimate that HED 3 Trispokes will save an extra 10 watts over Hed Bastogne wheels. Since there were other differences (wore a TT3 in July vs. a TT2 this time, and a skinsuit vs. road wheels) we have to be careful in making this conclusion. But if it is made, it also shows that the Roval wheels tested about the same as the trispokes and the Roval wheels saved about the same 10 watts the trispokes did.
Finally, to put it in perspective, we can list the wattage savings per unit cost.
|
Cost |
$/watts saved at 40km/h |
|
|
Clip-on bars |
$100-1200 |
$3.30-$40 |
|
Aero helmet |
$75-230 |
$8.30-25.50 |
|
Time trial bike |
$1000-10,000+ |
$50-500 |
|
Aero wheels |
$600-$8000 |
$60-800 |
How much is it worth? That's for you to decide.
Notes:
- We only used one rider and one set of equipment, which is great for controlling variables but it means we shouldn't generalise too much. We did anyway....
- Apart from the 'high' CdA in the Transition | Road Helmet | Aerobars track test, the other CdAs were all within 3% of the tunnel data. Not perfect but good for power testing, according to Mark Cote.
- Some of the savings going from the road bike with clip-ons to the time trial bike are due to position, not just frame aerodynamics.
- You will save more time but fewer watts at slower speeds with these improvements. The constants are the percentage aero drag savings.
- You can quickly learn a lot from wind tunnel testing, provided you have
people who know what they're doing.
Photography
For a thumbnail gallery of these images, click here
Images by Jeff Jones
- A Specialized Transition looking very aero in the A2 wind tunnel in North Carolina.
- Lowe's Motor Speedway in North Carolina. Normally used for NASCAR racing, but you can race bikes on it too.
- The control bike. The harpoon-like device is part of a mobile weather station.
- Nathan and Mike warm up for the track tests.
- Nathan rides the Tarmac road bike on the drops with road helmet.
- Nathan rides the Tarmac road bike on the clip-ons with road helmet.
- Nathan rides the Tarmac and clip-ons with TT2 helmet.
- Nathan rides the Transition with road helmet.
- Nathan rides the Transition with TT2 helmet.
- Mike Giraud on the control bike.
- Mark Cote and Dave Salazar analyse the data trackside.
- The nerve centre of the A2 wind tunnel.
- Outside the main tunnel, which is powered by four fans.
- One of the tunnel's four fans.
- Nathan O'Neill in the tunnel on a Tarmac SL2 with clipons and a road helmet.
- Testing one of the positions in the tunnel.
- Mike Giraud and Dave Salazar look at the data.
- The main players in the test: Jason (Caf:ine), Mark Cote.

